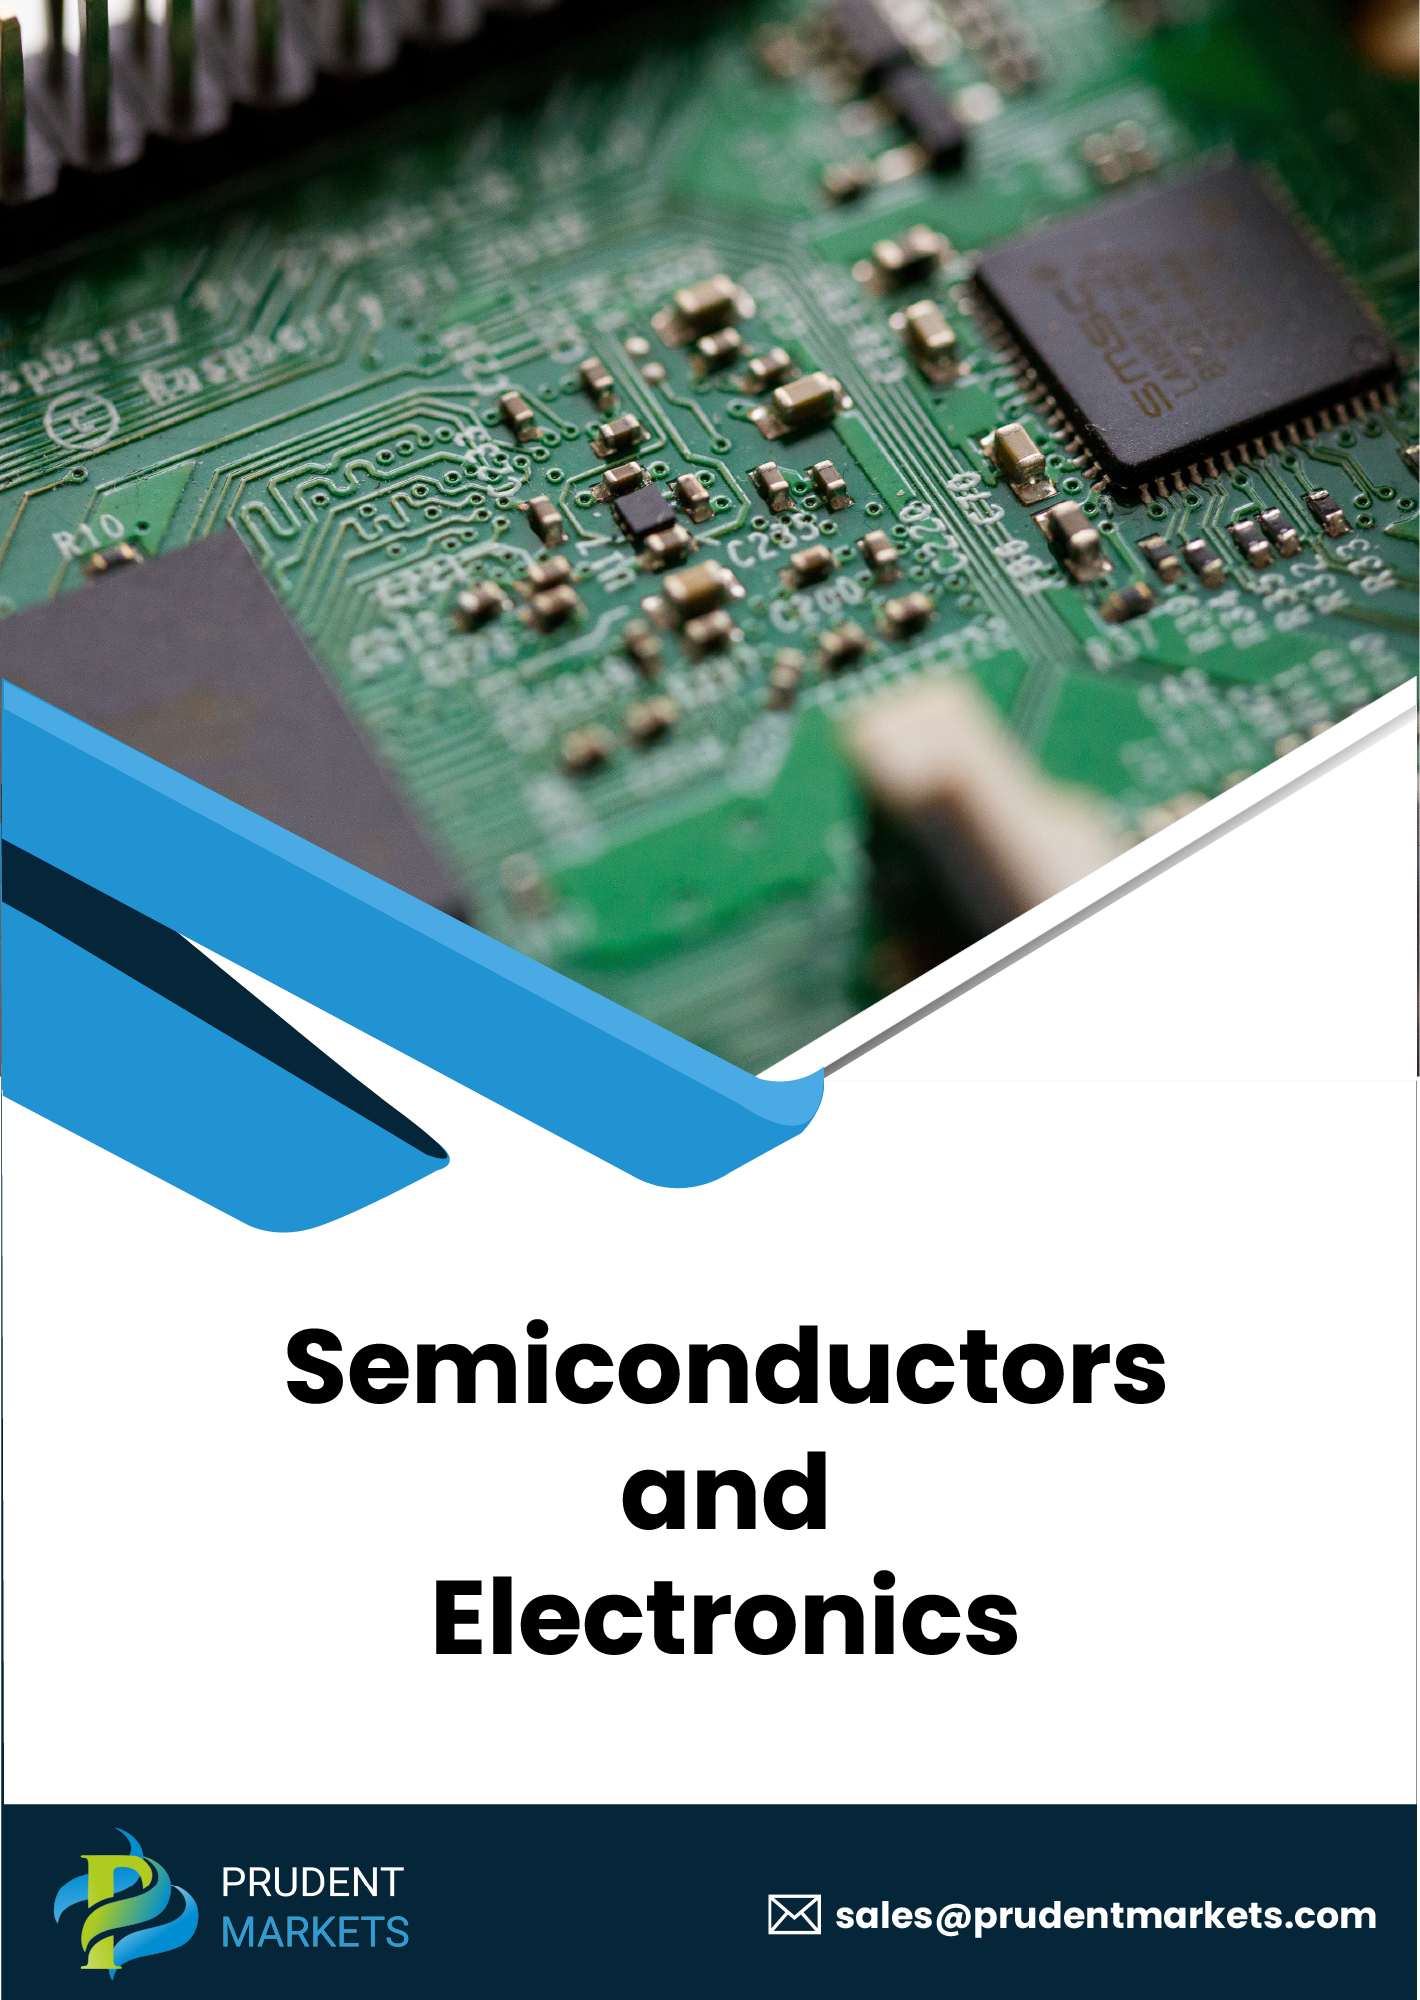
Silicon Carbide Power Semiconductors Market by Power Module (Power Product and Discrete Product) and Industry Vertical (IT & Telecom, Aerospace & Defense, Industrial, Energy & Power, Electronics, and Automotive & Healthcare) - Global Opportunity Analysis and Industry Forecast, 2018-2025
- Published Date: 2020-10-18
- Report ID: 3193
- Pages: 220
-
Format:

Silicon Carbide Power Semiconductors Market Overview :
The global silicon carbide (SiC) power semiconductor market was valued at $302 million in 2017, and is projected to reach $1,109 million by 2025, registering a CAGR of 18.1% from 2018 to 2025. The Asia-Pacific captured the highest market share of 49% in 2017 and is expected to be dominant throughout the forecast period, that is, 2018 to 2025.
Silicon carbide (SiC) power semiconductor is a compound semiconductor formed by combining silicon and carbide. It is majorly used in power electronics systems, which deal with control and conversion of electrical power effectively and efficiently. Silicon carbide (SiC) power devices have evolved from immature prototypes in laboratories to viable alternatives to Si-based power devices in high-efficiency and high-power density applications, owing to rapid innovation and development of the semiconductors industry.
SiC-based power devices have significant advantages over silicon-based power devices such as high breakdown voltage, high operating electric field, high operating temperature, high switching frequency, and low losses. SiC-based semiconductors are applicable in areas where high temperature, high voltage, and high-power density are required.
Increasing number of high-voltage, high-efficiency, and high-power density applications, such as industrial motor drives, telecommunication, renewable energy systems, and automotive electronics, drives the growth of the silicon carbide power semiconductors market. Moreover, there is increased penetration of electric vehicles, owing to government support and initiatives. Thus, increasing usage of SiC power devices in automotive electronics drives the market.
However, the growth of the SiC power semiconductors market is restrained by the high wafer cost of silicon carbide. High-purity SiC powder and high-purity silane (SiH4) are the critical precursors for producing SiC layers in the chips. High-purity SiC powder is currently available from a limited number of suppliers and is relatively expensive, while high-purity silane is produced by a few large multinational industrial gas companies. Thus, the market is restrained by the fewer raw material suppliers required for the creation of SiC substrates. However, owing to the rising technological developments, such as the advent of 5G, lucrative opportunities are created for the growth of the silicon carbide power semiconductors market.
The global silicon carbide (SiC) power semiconductors market is segmented by power module, industry vertical, and region. According to power module, it is bifurcated into power product and discrete product. On the basis of industry vertical, it is categorized into IT & telecom, aerospace & defense, industrial, energy & power, electronics, automotive, and healthcare. Based on region, it is analyzed across North America, Europe, Asia-Pacific, and LAMEA.
Key Benefits for Silicon Carbide Power Semiconductors Market :
This study comprises the analytical depiction of the global silicon carbide power semiconductors market along with the current trends and future estimations to depict the imminent investment pockets.
The overall market potential is determined to understand the profitable trends to gain a stronger coverage in the market.
The report presents information related to key drivers, restraints, and opportunities with a detailed impact analysis.
The current market is quantitatively analyzed from 2018 to 2025 to highlight the financial competency of the market.
Porters Five Forces analysis illustrates the potency of the buyers and suppliers.
Silicon Carbide Power Semiconductors Key Market Segments :
By Power Module
Power product
Discrete product
By Industry Vertical
IT & telecom
Aerospace & defense
Industrial
Energy & power
Electronics
Automotive
Healthcare
By Region
North America
U.S.
Canada
Mexico
Europe
UK
Germany
France
Italy
Rest of Europe
Asia-Pacific
China
India
Japan
Australia
South Korea
Rest of Asia-Pacific
LAMEA
Brazil
Saudi Arabia
South Africa
Rest of LAMEA
CHAPTER 1: INTRODUCTION
1.1. REPORT DESCRIPTION
1.2. KEY BENEFITS FOR STAKEHOLDERS
1.3. KEY MARKET SEGMENTS
1.4. RESEARCH METHODOLOGY
1.4.1. Primary research
1.4.2. Secondary research
1.4.3. Analyst tools and models
CHAPTER 2: EXECUTIVE SUMMARY
2.1. CXO PERSPECTIVE
CHAPTER 3: MARKET OVERVIEW
3.1. MARKET DEFINITION AND SCOPE
3.2. KEY FINDINGS
3.2.1. Top impacting factors
3.2.2. Top investment pockets
3.2.3. Top winning strategies
3.3. PORTERS FIVE FORCES ANALYSIS
3.3.1. Moderate to high bargaining power of suppliers
3.3.2. Moderate threat of new entrants
3.3.3. Moderate threat of substitutes
3.3.4. Moderate to high intensity of rivalry
3.3.5. Moderate to high bargaining power of buyers
3.4. KEY PLAYER POSITIONING, 2017 (%)
3.5. MARKET DYNAMICS
3.5.1. Drivers
3.5.1.1. Advantages of compound semiconductors (SiC) over silicon-based technology.
3.5.1.2. Increase in demand of power electronics modules across various industry verticals.
3.5.1.3. Rise in installation of solar photovoltaic panels for electricity generation.
3.5.1.4. Growth in demand of electric vehicles, plug-in electric vehicles, and hybrid electric vehicles .
3.5.2. Restraints
3.5.2.1. High wafer cost of silicon carbide semiconductors.
3.5.2.2. Complexity in supply chain and designing process of SiC semiconductor technology.
3.5.3. Opportunities
3.5.3.1. Advent of 5G mobile communication.
CHAPTER 4: SILICON CARBIDE (SIC) POWER SEMICONDUCTORS MARKET, BY POWER MODULE
4.1. OVERVIEW
4.2. POWER PRODUCTS
4.2.1. Key market trends, growth factors, and opportunities
4.2.2. Market size and forecast, by region
4.2.3. Market analysis, by country
4.3. DISCRETE PRODUCTS
4.3.1. Key market trends, growth factors, and opportunities
4.3.2. Market size and forecast, by region
4.3.3. Market analysis, by country
CHAPTER 5: SILICON CARBIDE (SIC) POWER SEMICONDUCTORS MARKET, BY INDUSTRY VERTICAL
5.1. OVERVIEW
5.2. IT & TELECOM
5.2.1. Key market trends, growth factors, and opportunities
5.2.2. Market size and forecast, by region
5.2.3. Market analysis, by country
5.3. AEROSPACE & DEFENSE
5.3.1. Key market trends, growth factors, and opportunities
5.3.2. Market size and forecast, by region
5.3.3. Market analysis, by country
5.4. INDUSTRIAL
5.4.1. Key market trends, growth factors, and opportunities
5.4.2. Market size and forecast, by region
5.4.3. Market analysis, by country
5.5. ENERGY & POWER
5.5.1. Key market trends, growth factors, and opportunities
5.5.2. Market size and forecast, by region
5.5.3. Market analysis, by country
5.6. ELECTRONICS
5.6.1. Key market trends, growth factors, and opportunities
5.6.2. Market size and forecast, by region
5.6.3. Market analysis, by country
5.7. AUTOMOTIVE
5.7.1. Key market trends, growth factors, and opportunities
5.7.2. Market size and forecast, by region
5.7.3. Market analysis, by country
5.8. HEALTHCARE
5.8.1. Key market trends, growth factors, and opportunities
5.8.2. Market size and forecast, by region
5.8.3. Market analysis, by country
CHAPTER 6: SILICON CARBIDE (SIC) POWER SEMICONDUCTORS MARKET, BY REGION
6.1. OVERVIEW
6.2. NORTH AMERICA
6.2.1. Key market trends, growth factors, and opportunities
6.2.2. Market size and forecast, by power module
6.2.3. Market size and forecast, by industry vertical
6.2.4. Market analysis, by country
6.2.4.1. U.S.
6.2.4.1.1. Market size and forecast, by Power module
6.2.4.1.2. Market size and forecast, by industry vertical
6.2.4.2. Canada
6.2.4.2.1. Market size and forecast, by Power module
6.2.4.2.2. Market size and forecast, by industry vertical
6.2.4.3. Mexico
6.2.4.3.1. Market size and forecast, by Power module
6.2.4.3.2. Market size and forecast, by industry vertical
6.3. EUROPE
6.3.1. Key market trends, growth factors, and opportunities
6.3.2. Market size and forecast, by Power module
6.3.3. Market size and forecast, by industry vertical
6.3.4. Market analysis, by country
6.3.4.1. U.K.
6.3.4.1.1. Market size and forecast, by Power module
6.3.4.1.2. Market size and forecast, by industry vertical
6.3.4.2. Germany
6.3.4.2.1. Market size and forecast, by Power module
6.3.4.2.2. Market size and forecast, by industry vertical
6.3.4.3. France
6.3.4.3.1. Market size and forecast, by Power module
6.3.4.3.2. Market size and forecast, by industry vertical
6.3.4.4. Italy
6.3.4.4.1. Market size and forecast, by Power module
6.3.4.4.2. Market size and forecast, by industry vertical
6.3.4.5. Rest of Europe
6.3.4.5.1. Market size and forecast, by Power module
6.3.4.5.2. Market size and forecast, by industry vertical
6.4. ASIA-PACIFIC
6.4.1. Key market trends, growth factors, and opportunities
6.4.2. Market size and forecast, by Power module
6.4.3. Market size and forecast, by industry vertical
6.4.4. Market analysis, by country
6.4.4.1. China
6.4.4.1.1. Market size and forecast, by Power module
6.4.4.1.2. Market size and forecast, by industry vertical
6.4.4.2. India
6.4.4.2.1. Market size and forecast, by Power module
6.4.4.2.2. Market size and forecast, by industry vertical
6.4.4.3. Japan
6.4.4.3.1. Market size and forecast, by Power module
6.4.4.3.2. Market size and forecast, by industry vertical
6.4.4.4. Australia
6.4.4.4.1. Market size and forecast, by Power module
6.4.4.4.2. Market size and forecast, by industry vertical
6.4.4.5. South Korea
6.4.4.5.1. Market size and forecast, by Power module
6.4.4.5.2. Market size and forecast, by industry vertical
6.4.4.6. Rest of Asia-Pacific
6.4.4.6.1. Market size and forecast, by Power module
6.4.4.6.2. Market size and forecast, by industry vertical
6.5. LAMEA
6.5.1. Key market trends, growth factors, and opportunities
6.5.2. Market size and forecast, by Power module
6.5.3. Market size and forecast, by industry vertical
6.5.4. Market analysis by country
6.5.4.1. Brazil
6.5.4.1.1. Market size and forecast, by Power module
6.5.4.1.2. Market size and forecast, by industry vertical
6.5.4.2. Saudi Arabia
6.5.4.2.1. Market size and forecast, by Power module
6.5.4.2.2. Market size and forecast, by industry vertical
6.5.4.3. South Africa
6.5.4.3.1. Market size and forecast, by Power module
6.5.4.3.2. Market size and forecast, by industry vertical
6.5.4.4. Rest of LAMEA
6.5.4.4.1. Market size and forecast, by Power module
6.5.4.4.2. Market size and forecast, by industry vertical
CHAPTER 7: COMPANY PROFILES
7.1. INFINEON TECHNOLOGY
7.1.1. Company overview
7.1.2. Company snapshot
7.1.3. Operating business segments
7.1.4. Business performance
7.1.5. Key strategic moves and developments
7.2. MICROSEMI CORPORATION
7.2.1. Company overview
7.2.2. Company snapshot
7.2.3. Operating business segments
7.2.4. Business performance
7.2.5. Key strategic moves and developments
7.3. GENERAL ELECTRIC COMPANY
7.3.1. Company overview
7.3.2. Company snapshot
7.3.3. Operating business segments
7.3.4. Business performance
7.3.5. Key strategic moves and developments
7.4. POWER INTEGRATION, INC.
7.4.1. Company overview
7.4.2. Company snapshot
7.4.3. Operating business segments
7.4.4. Business performance
7.4.5. Key strategic moves and developments
7.5. FAIRCHILD SEMICONDUCTOR (ON SEMICONDUCTOR)
7.5.1. Company overview
7.5.2. Company snapshot
7.5.3. Operating business segments
7.5.4. Business performance
7.5.5. Key strategic moves and developments
7.6. STMICROELECTRONICS
7.6.1. Company overview
7.6.2. Company snapshot
7.6.3. Operating business segments
7.6.4. Business performance
7.6.5. Key strategic moves and developments
7.7. TOKYO ELECTRON LIMITED
7.7.1. Company overview
7.7.2. Company snapshot
7.7.3. Operating business segments
7.7.4. Business performance
7.7.5. Key strategic moves and developments
7.8. RENESAS ELECTRONICS CORPORATION
7.8.1. Company overview
7.8.2. Company snapshot
7.8.3. Operating business segments
7.8.4. Business performance
7.8.5. Key strategic moves and developments
7.9. TOSHIBA CORPORATION
7.9.1. Company overview
7.9.2. Company snapshot
7.9.3. Operating business segments
7.9.4. Business performance
7.9.5. Key strategic moves and developments
7.10. CREE, INC.
7.10.1. Company overview
7.10.2. Company snapshot
7.10.3. Operating business segments
7.10.4. Business performance
7.10.5. Key strategic moves and developments
7.11. ROHM CORPORATION
7.11.1. Company overview
7.11.2. Company snapshot
7.11.3. Operating business segments
7.11.4. Business performance
7.11.5. Key strategic moves and developments
7.12. NXP SEMICONDUCTORS
7.12.1. Company overview
7.12.2. Company snapshot
7.12.3. Operating business segments
7.12.4. Business performance
7.12.5. Key strategic moves and developments

Call Us
( India toll free )
+91 835 605 0278
( US toll free )
+1 800 601 6071
Drop us an email at
sales@prudentmarkets.com
Get your pre and post sales queries resolved by our Subject matter experts.
We will assist you to customize the report to fit your research needs.
Our prime focus is to provide qualitative and accurate data.
Feel free to order a sample report before purchase.
Your personal and confidential information is safe and secured.
